Numerical Simulation of Filtration Characteristics of Ship Pipe Filters
Abstract: This study explores the impact of filtration velocity and particle throughput on the pressure drop and filtration efficiency of ship pipe filters. The Discrete Phase Model (DPM) in Computational Fluid Dynamics (CFD) was used to model the filtration process under various operating conditions. The pressure field, velocity field, and particle flow distribution within the filter were calculated and validated against experimental data. The findings demonstrate good correlation between simulation results and experimental data. The pressure drop across the filter increases with the flow rate. The optimal filtration velocity is approximately 1.8 m/s. The most significant flow variation occurs at the filter screen and outlet pipe. At a particle throughput of 0.0001 kg/s, the filtration efficiency reaches a peak of 60.22%. Filtration efficiency increases with both water and particle flow rates, although the effect on efficiency is marginal.
Introduction
Filters are widely used in applications such as ship ballast water treatment, municipal wastewater treatment, and nuclear power systems. The design and classification of filters depend on the specific operating conditions. Filters are typically categorized into mesh, laminated, and centrifugal filters. The primary filter used in ship ballast water systems is the pipeline filter, a type of mesh filter known for its compact design, ease of assembly and disassembly, stable operation, high efficiency, and cost-effectiveness. Key performance indicators for evaluating filter performance include filtration efficiency and pressure drop. As water flows through the filter, larger particles are captured, while smaller particles pass through the mesh. To improve filtration efficiency, the pipe filter's pore size can be reduced; however, this increases pressure drop. Conversely, increasing the pore size to reduce pressure drop results in a significant decrease in filtration efficiency. Therefore, filter structure design must balance environmental requirements with structural strength, focusing on optimizing pore size and refining structural design. This balance is crucial for enhancing filtration efficiency while minimizing pressure drop.
The filter screen of the pipeline mesh filter is made up of a perforated plate structure. Filtration mechanisms such as interception, inertia, diffusion, sedimentation, and fluid dynamics contribute to the screen's performance. The primary function of the filter screen is to capture particulate matter, directly affecting filtration efficiency. Computational Fluid Dynamics (CFD) is used to create a three-dimensional model of the filter mesh, enabling the analysis of filter performance and particle flow distribution by adjusting flow field conditions and structural parameters. Compared to experimental methods, CFD offers significant cost and time savings. Additionally, CFD is used to evaluate the effects of factors such as flow velocity and particle throughput on pressure drop and filtration efficiency. A comprehensive understanding of flow dynamics within the filter is essential for optimizing filter performance.
1. Model Development and Numerical Simulation
1.1 Filter Model
The filter screen is the most critical component, as it experiences the highest pressure drop and operates under the most complex conditions. The development of the three-dimensional solid model considers both the overall flow field within the filter and the flow dynamics across the filter screen. Water enters the filter through the inlet and exits through the outlet after passing through the filter screen. The filter's structural specifications are as follows: the inlet and outlet sizes are DN100, the filter screen diameter is 127 mm, the thickness is 3 mm, and the aperture size is 8 mm. The structural model is shown in Figure 1, and the three-dimensional flow field model of the filter is shown in Figure 2. Computational Fluid Dynamics (CFD) was used to mesh the filter's flow field model, as shown in Figure 3. The model is composed of 3,074,414 grid points, with a grid quality factor of 0.7.
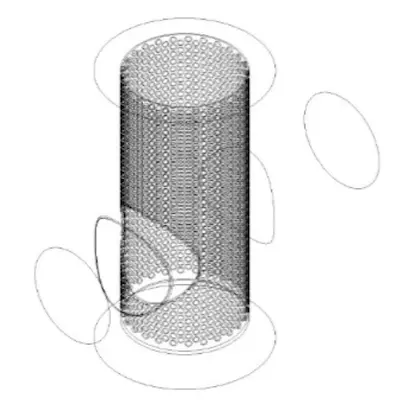
Figure 1: Filter Structure
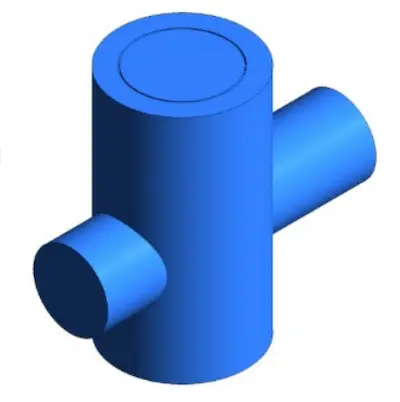
Figure 2: Filter Flow Field Model
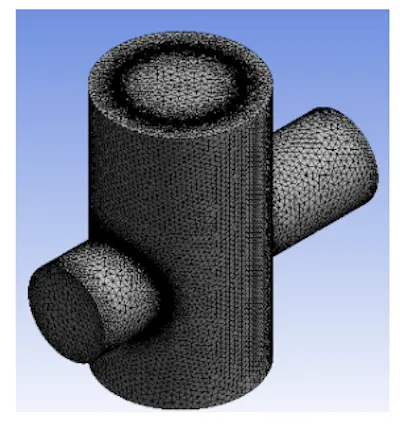
Figure 3: Filter Meshing
1.2 Calculation and Discretization
The calculation model uses a continuous medium flow model combined with the Discrete Phase Model (DPM), with key governing equations including momentum, energy, mass, and particle motion. The SIMPLE algorithm, which couples pressure and velocity, is applied for the iterative solution. The second-order upwind scheme is used for discretization, and the Realizable k-ε turbulence model is applied to simulate the steady-state flow field. The second-order upwind scheme, which provides higher accuracy, is used to discretize momentum, pressure, turbulent kinetic energy, and turbulent dissipation rate. An appropriate iteration step size is chosen. The water flow is assumed to be incompressible, and filter deformation is neglected, with the structure assumed to be rigid. The discrete phase particles are modeled as steady-state, inert spherical particles, with phase coupling considered. The coupled solution is computed simultaneously with the continuous phase.
1.3 Boundary Conditions and Experimental Setup
The filter inlet is modeled as a velocity inlet, and the outlet is modeled as a pressure outlet with an outlet pressure of 200 kPa. The filter medium is clean water, with a density of 1000 kg/m³ and a kinematic viscosity of 1.3×10⁻⁶ m²/s. The particle size distribution in the DPM model follows the Rosin-Rammler distribution. The water inlet, outlet, filter screen, and filter housing are defined as no-slip walls. The boundary conditions for the housing, inlet, and outlet are set to 'reflect,' while the boundary condition for the filter screen is set to 'trap' to ensure particle capture. The experimental setup uses clean water as the flow medium, with a valve used to control the water inlet flow rate, and the inlet-outlet pressure difference is recorded.
1.4 Pressure Difference and Filtration Efficiency Calculation
The DPM is used for both the calculation and post-processing of inlet and outlet pressures. The formula for the inlet-outlet pressure difference is as follows:

Where Pin is the inlet pressure, Pout is the outlet pressure, and it is assumed that pressure is uniformly distributed at both the inlet and outlet. Particle flow is calculated using the Particle Track function, which determines the total number of particles, as well as the number of captured and escaped particles. Filtration efficiency is calculated using the following formula:

Where S_interception is the number of particles intercepted by the filter, S_inlet is the total number of particles at the inlet, and S_outlet is the number of particles at the outlet.
2. Results and Analysis
2.1 Flow Rate-Pressure Difference Performance Curve of the Filter
Figure 4 presents the simulated inlet and outlet pressure differences at various inlet flow rates, compared with experimental data obtained from the ballast water test platform. The simulation results closely match the experimental data, with a maximum deviation of 12%, demonstrating the reliability of the simulation. The filter's pressure loss increases as the inlet velocity rises. As the water flow rate increases from 0.5 m/s to 2.5 m/s, the inlet and outlet pressure difference rises from 266.1 Pa to 5322.74 Pa. The pressure loss gradient increases with velocity, aligning with the actual behavior of the filter. In filter design, the resistance coefficient is typically required to remain below 2.5, implying that the pressure difference should not exceed 1900 Pa. Based on this, it can be concluded that the maximum allowable inlet velocity for practical applications of the filter is 1.8 m/s.
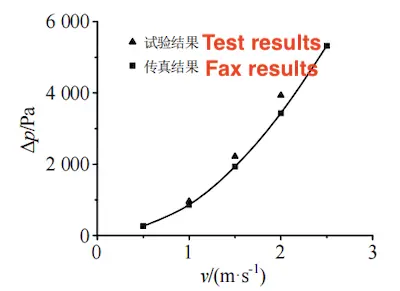
Figure 4 Filter Inlet and Outlet Pressure Difference vs. Water Flow Velocity
2.2 Analysis of the Internal Flow Field of the Filter
Figures 5 and 6 illustrate the pressure and velocity distributions within the filter at an inlet velocity of 1.0 m/s. These figures demonstrate that the filter’s pressure distribution is relatively uniform across the structure, with higher pressure at the inlet and lower pressure at the outlet. The filter screen exhibits significant blockage, resulting in a clear pressure drop, which aligns with actual operating conditions. As water flows through the filter screen, turbulence is generated due to the screen’s mesh, creating a noticeable recirculation pattern downstream. Additionally, reverse flow velocities are observed at the upper and lower ends of the filter, further confirming the filtering effect of the screen. Because the outlet pipe is perpendicular to the filter cylinder, the boundary conditions at the outlet cause the velocity component along the pipe wall to decrease gradually, while the velocity component along the pipe axis increases. This leads to the formation of a "Y"-shaped turbulent region in the outlet pipe flow field.
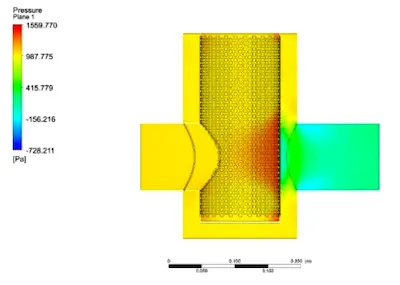
Figure 5 Filter Pressure Distribution
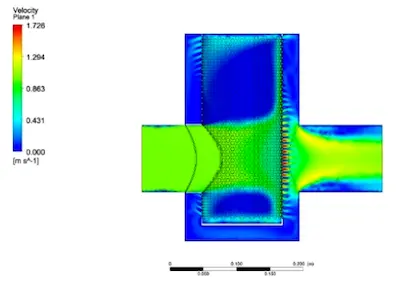
Figure 6 Filter Velocity Distribution
2.3 Analysis of the Filter's Filtration Characteristics
Figure 7 shows the particle distribution within the filter at an inlet velocity of 1.0 m/s. The particles are evenly distributed in the inlet area, with a noticeable reduction in particle concentration after passing through the filter. The filter demonstrates high interception efficiency, and the particles are not significantly influenced by gravity during filtration. Figure 8 presents the filtration efficiency curve for the filter at varying inlet velocities. Filtration efficiency increases as water flow velocity rises. This is because higher flow velocity increases the distance over which water interacts with particles, leading to more collisions with the filter surface before particles are carried away with the water flow and captured. However, the increase in filtration efficiency is minimal. For these calculations, only the filter's performance in its initial state is considered, excluding the effects of filter clogging. At a given flow rate, filtration efficiency can be estimated by adjusting the inlet velocity. Figure 9 shows the filter efficiency at different particle flow rates, with a flow velocity of 1.0 m/s. Filtration efficiency increases with the particle flow rate. As the flow rate increases, the number of particles increases, leading to more particles being captured by the filter. When the particle flow rate increases from 0.0001 kg/s to 0.0006 kg/s (a sixfold increase), filtration efficiency rises from 59.84% to 60.22%, a 0.63% increase. This suggests that the particle flow rate has minimal impact on filtration efficiency and can be considered negligible. Even with a sixfold increase in particle flow rate, the mass fraction in water remains just 0.008%, a very small proportion, indicating that the particle phase has a minimal effect on the water phase.
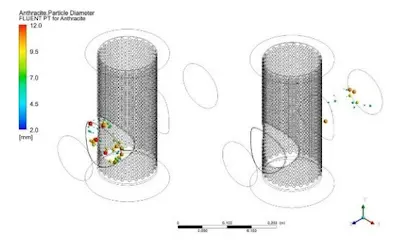
Figure 7 Particle Distribution Inside the Filter
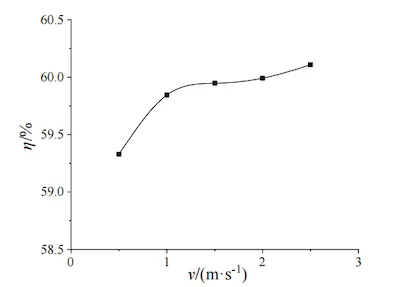
Figure 8 Filtration Efficiency vs. Water Flow Velocity
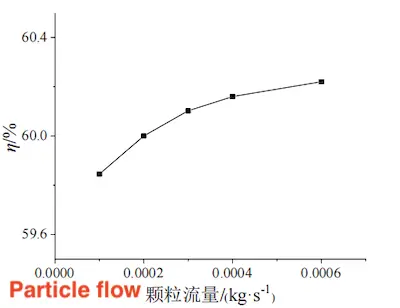
Figure 9 Filtration Efficiency vs. Particle Flow Rate
3. Conclusion
The filtration characteristics of the pipe filter were analyzed using computational fluid dynamics (CFD), with a focus on the impact of water flow rate on the pressure differential and the effects of flow rate, particle flow rate, and other factors on filtration efficiency. The following conclusions can be drawn:
(1) The simulation results closely align with the experimental data, with a maximum deviation of 12%. The pressure differential between the filter’s inlet and outlet increases as the inlet velocity rises, and the rate of increase becomes steeper at higher velocities. According to the design specifications, the maximum allowable inlet velocity should be approximately 1.8 m/s.
(2) Filtration efficiency increases with both water flow velocity and particle flow rate. The filter exhibits high interception efficiency, but the improvement in filtration efficiency is marginal, indicating that the impact of flow velocity and particle flow rate on filtration efficiency is negligible and can be disregarded.
(3) Based on these findings, it is evident that the simulation accounts only for the initial filtration effect. Further research is required to assess the filter’s performance under blockage. The filter has some limitations, such as excessive pressure drop at higher flow velocities and suboptimal filtration performance. Ongoing optimization of the filter’s design and structure is necessary.


